The Two Errors Nobody Prices
Every procurement decision under demand uncertainty involves two possible mistakes.
Underage: you ordered less than demand. You run out during the campaign window. Lost sales, disappointed customers, a marketing team that spent budget on awareness for a product people couldn't find.
Overage: you ordered more than demand. The campaign ends. You're sitting on licensed inventory that has a hard shelf life — not because the product expires, but because the license does.
The cost of underage (Cu) is the margin you didn't capture plus the brand effect of the stockout. The cost of overage (Co) is the purchase price minus whatever you can recover — the salvage value.
For most standard products, both errors are painful but roughly comparable. For promotional collab launches, they are not. The overage cost is structurally higher, for one simple reason: licensed packaging has near-zero salvage value after the campaign ends.
You can't sell a co-branded product after the IP window closes. You can't repurpose the packaging. What you have is inventory that is worth either its raw material value or nothing at all.
The Formula That Changes the Answer
The newsvendor model (from inventory theory) gives the optimal order quantity under demand uncertainty:
Q* = F⁻¹(Cu / (Cu + Co))
Where F⁻¹ is the inverse of the demand distribution — the percentile of demand you should target. The ratio Cu/(Cu + Co) is called the critical ratio.
What this says: the optimal order is not the expected (mean) demand. It's a specific percentile of the demand distribution, determined entirely by the relative cost of the two errors.
If Cu >> Co — ordering too few is much more expensive than ordering too many — you should order above the median. Bias toward coverage.
If Co >> Cu — overage is more expensive — you should order below the median. Bias toward conservation.
For most promotional launches, Co is high (salvage ≈ 0) and Cu is moderate (the margin on a limited-edition item matters, but a stockout is not catastrophic to the core business). The critical ratio lands below 0.5. The model says: order less than you expect to sell.
This feels wrong. It isn't.
A Worked Example
Imagine a food chain launching a collab product — a limited-edition item tied to a licensed IP, running for 10 weeks across 400 locations.
Demand forecast: 500 units per location. Standard deviation: 150 units (high uncertainty — no sales history, new IP).
Cost structure:
- Purchase price: $4.20/unit
- Selling price: $6.50/unit
- Margin (Cu per unit): $2.30
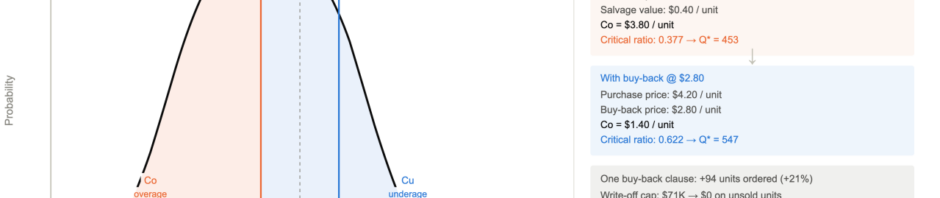
- Salvage value after campaign: $0.40/unit (raw material recovery only)
- Co per unit: $4.20 − $0.40 = $3.80
Critical ratio: Cu / (Cu + Co) = 2.30 / (2.30 + 3.80) = 0.377
Optimal order quantity: the 37.7th percentile of a normal distribution with mean 500 and σ = 150.
Q* = 500 + (−0.312) × 150 ≈ 453 units per location
Not 500. Not "what marketing forecasted." 453 — because overage is 1.65× more expensive than underage in this structure.
At Q=500 (mean demand), the expected leftover is not zero — it’s approximately 60 units per location, because about half of all scenarios produce a shortfall and half produce a surplus, and the surplus side is uncapped. At $3.80 per unsold unit across 400 locations, the expected write-off from ordering the forecast is ~$91K per launch. The optimal order of 453 reduces expected leftover to ~39 units per location — a write-off of ~$60K. Lost sales rise by ~$24K, so the net gain is ~$7K per launch — small here, but it grows fast as uncertainty rises or salvage value falls.
The Buy-Back Shift
Here is where the structure of the supplier contract changes everything.
Some suppliers — particularly in packaged goods categories where the supplier is also the IP holder or the manufacturer — offer buy-back arrangements: they will repurchase unsold units at the end of the campaign at an agreed price.
Say the supplier agrees to a buy-back at $2.80/unit (67% of purchase price).
Co now becomes: $4.20 − $2.80 = $1.40 per unit (instead of $3.80).
New critical ratio: 2.30 / (2.30 + 1.40) = 0.622
New Q*: 500 + (0.310) × 150 ≈ 547 units per location
The optimal order just jumped from 453 to 547 — a 21% increase — because one clause in the contract restructured the cost of being wrong.
The buy-back doesn't eliminate overage. It caps it. And that changes how aggressively you should commit.
This is why buy-back contracts are not just a risk-sharing tool. They are a demand signal: a supplier willing to offer buy-back is effectively saying "I have more confidence in this product than the current pricing reflects." It's worth reading it that way.
Not All Collabs Are the Same Cu/Co
The newsvendor model reveals something that gets flattened in most launch planning: different collaboration types have structurally different cost profiles, and therefore different optimal order quantities — even at identical demand forecasts.
A collab tied to a long-running IP with high baseline recognition has a different salvage curve than one tied to a trend-driven cultural moment with a hard expiration date. The first may have residual demand after the campaign window; the product can move through clearance without the IP value collapsing. The second has no tail. The license ends, the cultural moment passes, and the inventory becomes a write-down.
Same sales forecast. Same unit economics. Different optimal Q*.
A useful framework before signing a purchase order:
Type A — Evergreen IP, flexible window: Salvage value moderate, campaign end date soft. Co is manageable. Order at or above median demand.
Type B — Trend-driven IP, hard license expiry: Salvage near zero after date. Co is high. Order conservatively — at the 30th to 40th percentile of demand, not the forecast mean. The worked example (CR = 0.377) lands squarely here. Negotiate buy-back aggressively: even partial salvage recovery meaningfully raises CR and shifts the optimal quantity upward.
Type C — Own IP or no license constraint: Residual inventory is a standard markdowns problem, not a write-off. Standard continuous review applies.
Running all three through the same ordering logic is a systematic error that compounds across a portfolio of launches.
What This Means Before the Next Launch
The newsvendor model doesn't require a statistics degree to apply. It requires two numbers that procurement should be able to estimate for any collab: the cost of running out and the cost of being stuck.
Before signing the purchase order:
1. Estimate the critical ratio explicitly. What is the margin on each unit sold? What is the effective cost of each unit left over, accounting for salvage? The ratio of those two numbers determines the percentile of demand you should target — not the mean.
2. Separate demand uncertainty from cost structure. A high-confidence demand forecast still needs the right order percentile. A buy-back contract matters more when demand variance is high.
3. Treat the buy-back negotiation as a separate value lever. A buy-back at 60% of purchase price on a zero-salvage product is worth more than a 3% reduction in unit price. Price it that way.
4. Set an explicit write-off threshold before the launch. If ending inventory above X units triggers a write-down that makes the launch NPV-negative, that threshold is the exit criterion — and it should be agreed before the product ships, not discovered after.
The math doesn't eliminate uncertainty. It structures how you carry it.
Most promotional launches are decided on the forecast. The forecast is the least important input in the model.
Originally published on .
