Most procurement teams think they're managing risk. They're not. Here's what we found.
Last year we launched a major transformation of the supply chain function at Dodo Brands.
The core structural decision: move from a country-by-country model to a functional one. We built dedicated global and regional procurement teams — with identical roles and the same mandate. The difference isn't what they do, it's where they play. Regional teams own categories that are best sourced locally. The global team owns categories where we can extract maximum economies of scale across 25 countries — dairy, coffee, packaging, and other high-spend, high-volatility commodities.
With that structure in place, we asked ourselves: if the global team's job is to capture scale effects that no single market could unlock alone — what are the most sophisticated tools available to actually do that?
That question led us to FOS.
What is the FOS model — and why it matters
The Forward-Option-Spot model is the academic gold standard for procurement portfolio optimization. The logic is elegant and counterintuitive for most buyers:
Instead of committing 100% of volume to long-term forwards (predictable but inflexible), or relying heavily on the spot market (cheap sometimes, catastrophic when supply tightens) — you build a portfolio of purchasing instruments:
→ Forwards — locked price, locked volume. Zero variance. Your stable base. → Options — you pay a small upfront premium to reserve capacity. You exercise only if demand materializes. Flexibility without full exposure. → Spot — open market purchases to cover residual demand after forwards and options are exhausted.
Think of it exactly like a financial portfolio. Forwards are bonds. Options are derivatives. Spot is a leveraged position.
For categories like dairy and coffee — where prices swing on weather, geopolitics, and logistics shocks — this three-channel framework gives category managers a real mathematical tool, not a spreadsheet heuristic. You minimize expected total cost under uncertainty by finding the optimal split between all three channels.
, , and I got genuinely excited about this. It matched the complexity of what a global category team actually faces. So we went deep.
And found two critical flaws.
The two assumptions that break FOS in a real crisis
Assumption 1: Spot quality = Forward quality. The model treats a unit from an anonymous broker as identical to a unit from your audited, long-term supplier. During a supply crunch, top-tier manufacturers fulfill forward obligations first. What flows into the spot market is marginal stock, aged inventory, or counterfeits. Nobel laureate George Akerlof called this "the Market for Lemons." In B2B procurement, it's the rule — not the exception.
Assumption 2: The spot market has infinite depth. Standard FOS assumes you can always buy your way out of a shortage. In 2021, semiconductor buyers discovered otherwise. There is a hard physical ceiling — finite stock in global broker networks. When residual demand hits that ceiling, the supply curve goes vertical. No price clears the market. You don't get the units.
Both assumptions hold fine in normal conditions. Both collapse precisely when your procurement strategy matters most.
So we extended the model — and built EFOS.
The Extended Stochastic Portfolio Procurement Optimization Model (EFOS) adds two variables the standard FOS ignores.
Variable 1: β — the Stochastic Defect Rate
Spot quality risk is modeled as a Beta distribution: β_spot ~ Beta(α, γ), bounded strictly on (0,1). This creates a fundamental distinction between nominal quantity purchased and effective quantity received:
Q_eff = Q · (1 − β)
To physically satisfy demand D, your nominal purchase requirement scales non-linearly upward:
Q_req = D / (1 − β)
This leads to the Effective Price Function — the true, risk-adjusted cost per usable unit from the spot market:
P_eff(s, β) = s / (1 − β) + c_disp · β / (1 − β)
As defect rate approaches 1, effective price approaches infinity — non-linearly. At a 30% spot defect rate on a $200 nominal price, you're paying $285+ per good unit before disposal costs. The model calls this the Lemons Multiplier.
Variable 2: C_spot — the Spot Capacity Constraint
The spot market has finite physical depth. Actual deliverable spot volume is bounded by:
q_s = min( (D − Q_port) / (1 − β_spot) , C_spot )
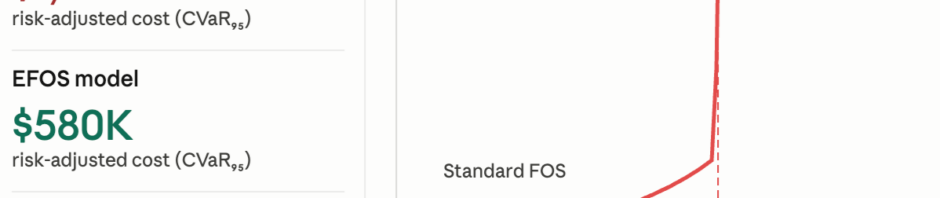
When demand hits the wall at C_spot, the supply curve transitions instantaneously from a standard upward slope to a vertical line — what EFOS calls the Supply Cliff. Beyond that point, no price clears the market. The firm incurs hard shortage penalties π for every unfulfilled unit.
The full EFOS objective function minimizes expected total cost across four mutually exclusive demand scenarios — from demand satisfied by forwards alone, through options, spot, and finally hard shortage — integrated over the joint probability distribution of demand, spot price, and defect rate via Monte Carlo simulation.
The good news mathematically: adding these non-linear, asymptotic terms doesn't break convexity. The Hessian of the total expected cost function is strictly positive definite — EFOS has a provably unique global optimum.
What the simulation showed
100,000-iteration Monte Carlo. Same demand trajectories for both models (Common Random Numbers). Parameters: demand N(100K, 20K), spot defects Beta(2,18) — 10% expected mean with heavy tail, spot capacity hard-capped at 20,000 units.
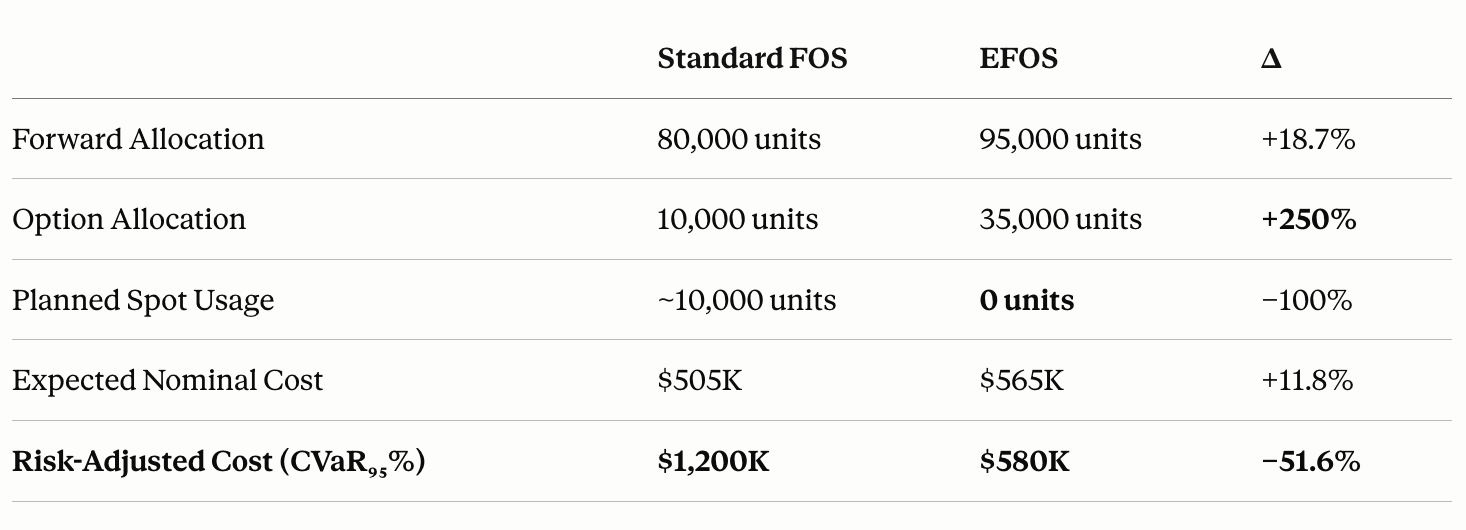
95% confidence intervals don't overlap. The gap is ~$600K of empty mathematical space. The outperformance is structural, not noise.
EFOS costs more at baseline — it over-hedges through options and deliberately eliminates spot exposure. But it cuts total systemic risk by more than half by neutralizing the right-tail catastrophe the standard model is blind to.
The real implication for how procurement is managed
This is ultimately an argument against PPV (Purchase Price Variance) as a primary KPI.
PPV penalizes buyers for paying option premiums. It rewards spot market gambling. It optimizes for nominal cost today while hiding the tail risk that stops your production line when reality doesn't behave like a normal distribution.
The shift EFOS demands: measure Risk-Adjusted Cost. Treat option premiums as Quality Assurance Insurance — because that's mathematically what they are.
What risk metrics is your procurement team actually using?
Originally published on .
